Blog

Site of the Month: 5 Lessons from Toronto's Open Data Portal

November's CKAN Site of the Month scores its data quality, designs with its users and reports its challenges in public. Here's what other portal teams can borrow.

Illustration of the Toronto skyline above an open data portal, with two people reviewing data quality checks and charts

November’s CKAN Site of the Month is the City of Toronto’s Open Data Portal. Toronto launched its first open data website in 2009, adopted CKAN as the portal’s backend in 2018, and documents its work in public, from a yearly roadmap to quarterly updates.

What makes Toronto worth studying isn’t the software. It’s how the team treats the portal: as a public service that keeps improving, with decisions based on evidence and problems reported openly. Here are five lessons other portal teams can borrow.

5.8M+
API requests, July to September 2026
23k
Files downloaded in the same quarter (23,132)
556
Datasets in the catalogue, November 2026
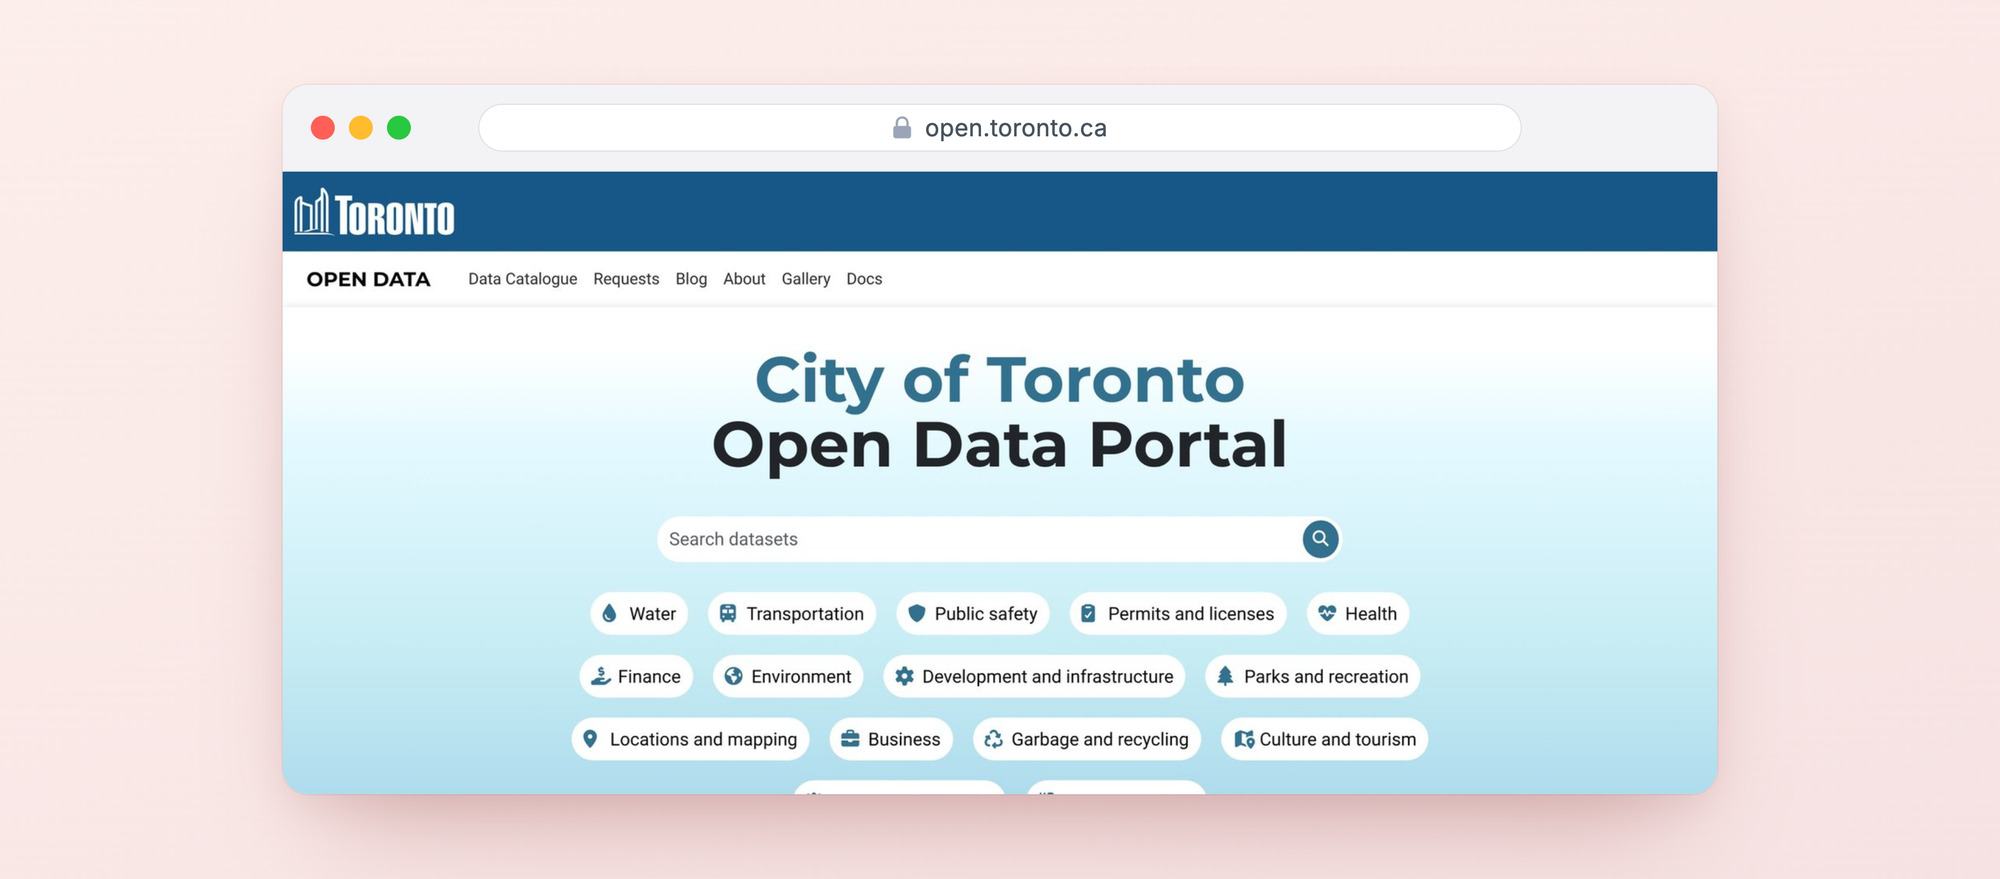
The City of Toronto Open Data Portal homepage with a dataset search box and topic shortcuts
The City of Toronto Open Data Portal. Screenshot: open.toronto.ca, City of Toronto.
01
Measure quality, not quantity

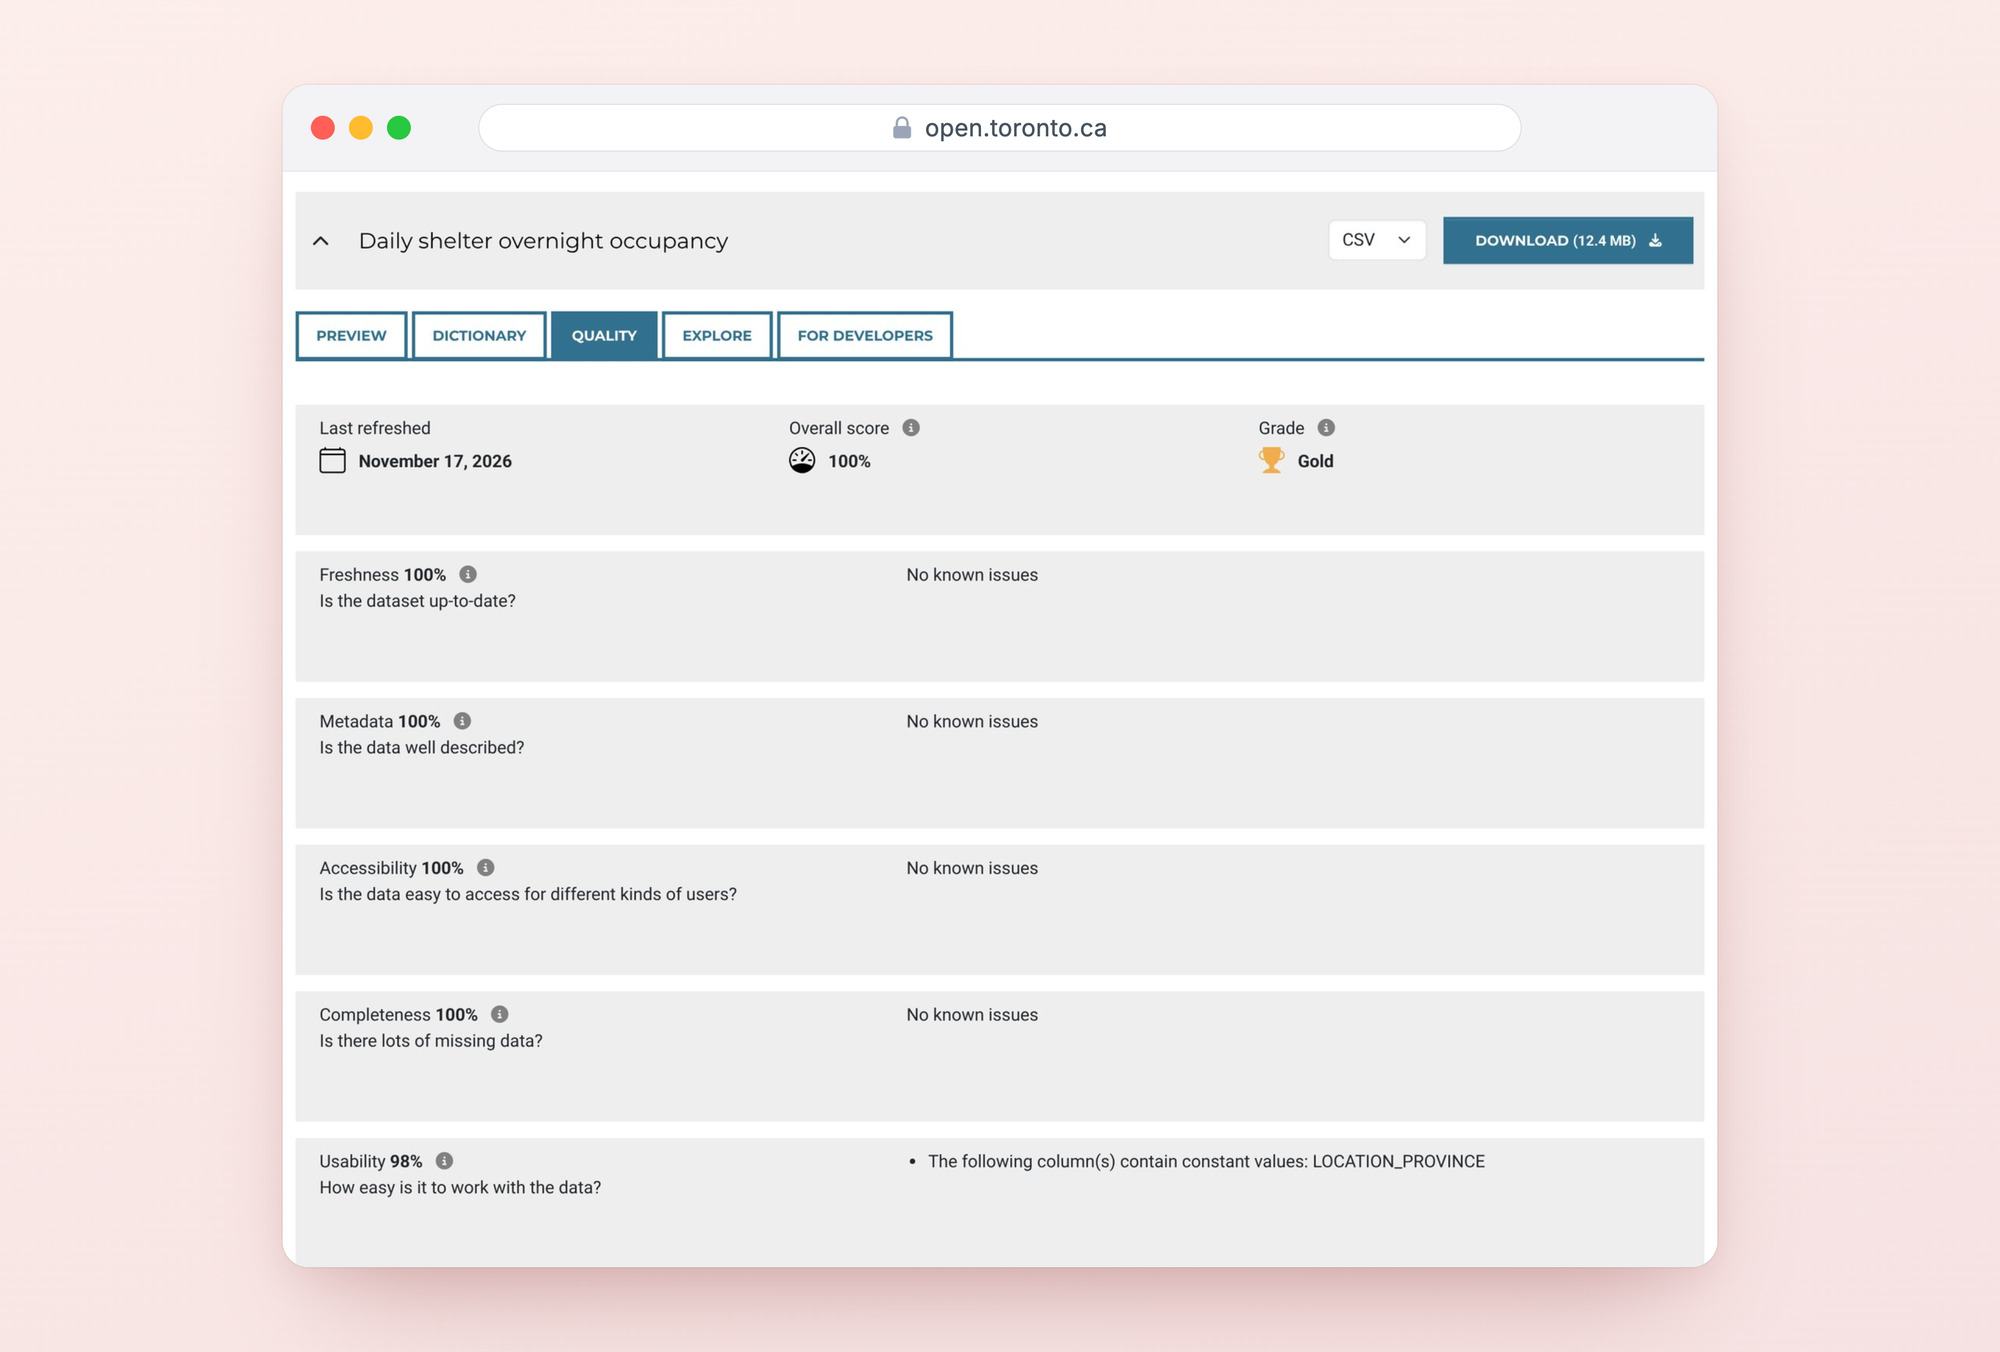
Toronto realised that counting datasets encouraged publishing more, rather than making existing data more useful. The risk was a catalogue full of outdated or poorly documented data. So the team now scores the quality of its datasets and shows the grade on each dataset page.

How the score works. In Toronto’s own model (2023 update), each dataset is scored on five dimensions: freshness (35%), metadata (35%), accessibility (15%), completeness (10%) and usability (5%). Datasets scoring 80 or more are graded Gold, 60 to 79 Silver, and below 60 Bronze.

Why it matters. Freshness and metadata together make up 70% of the score, which puts the emphasis on whether data is current and understandable. Data stored in the portal’s database, rather than as a file, scores higher on accessibility, because the portal can then offer a preview and several download formats. The scores themselves are published as an open dataset, updated weekly. Toronto’s roadmap includes an upgrade to the score in Q4 2026. The scoring model is Toronto’s own work, built on top of CKAN, not a built-in CKAN feature.

Toronto’s scoring model (2023 update)
Freshness 35%
Is it kept up to date?
Metadata 35%
Is it described well enough to use?
Accessibility 15%
Easy to open, preview and download?
Completeness 10%
How much data is missing?
Usability 5%
Is it easy to work with?
Gold
80 and above
Silver
60 to 79
Bronze
Below 60
The Quality tab on a Toronto dataset page, showing an overall score of 100%, a Gold grade and a score for each dimension
The Quality tab on a live dataset page: overall score, grade and each dimension, with any known issues. Daily Shelter & Overnight Service Occupancy & Capacity, November 2026. Screenshot: open.toronto.ca, City of Toronto.
For your portal
Start measuring whether your datasets are up to date and well documented, not just how many you’ve published.

A bigger catalogue isn’t a better one. Quality is what people can use.

02
Design with users, not for them

When Toronto redesigned its dataset pages in 2025, the team didn’t rely on assumptions. It researched how people actually use open data: it reviewed 13 other data portals, collected 53 survey responses and ran 16 usability interviews.

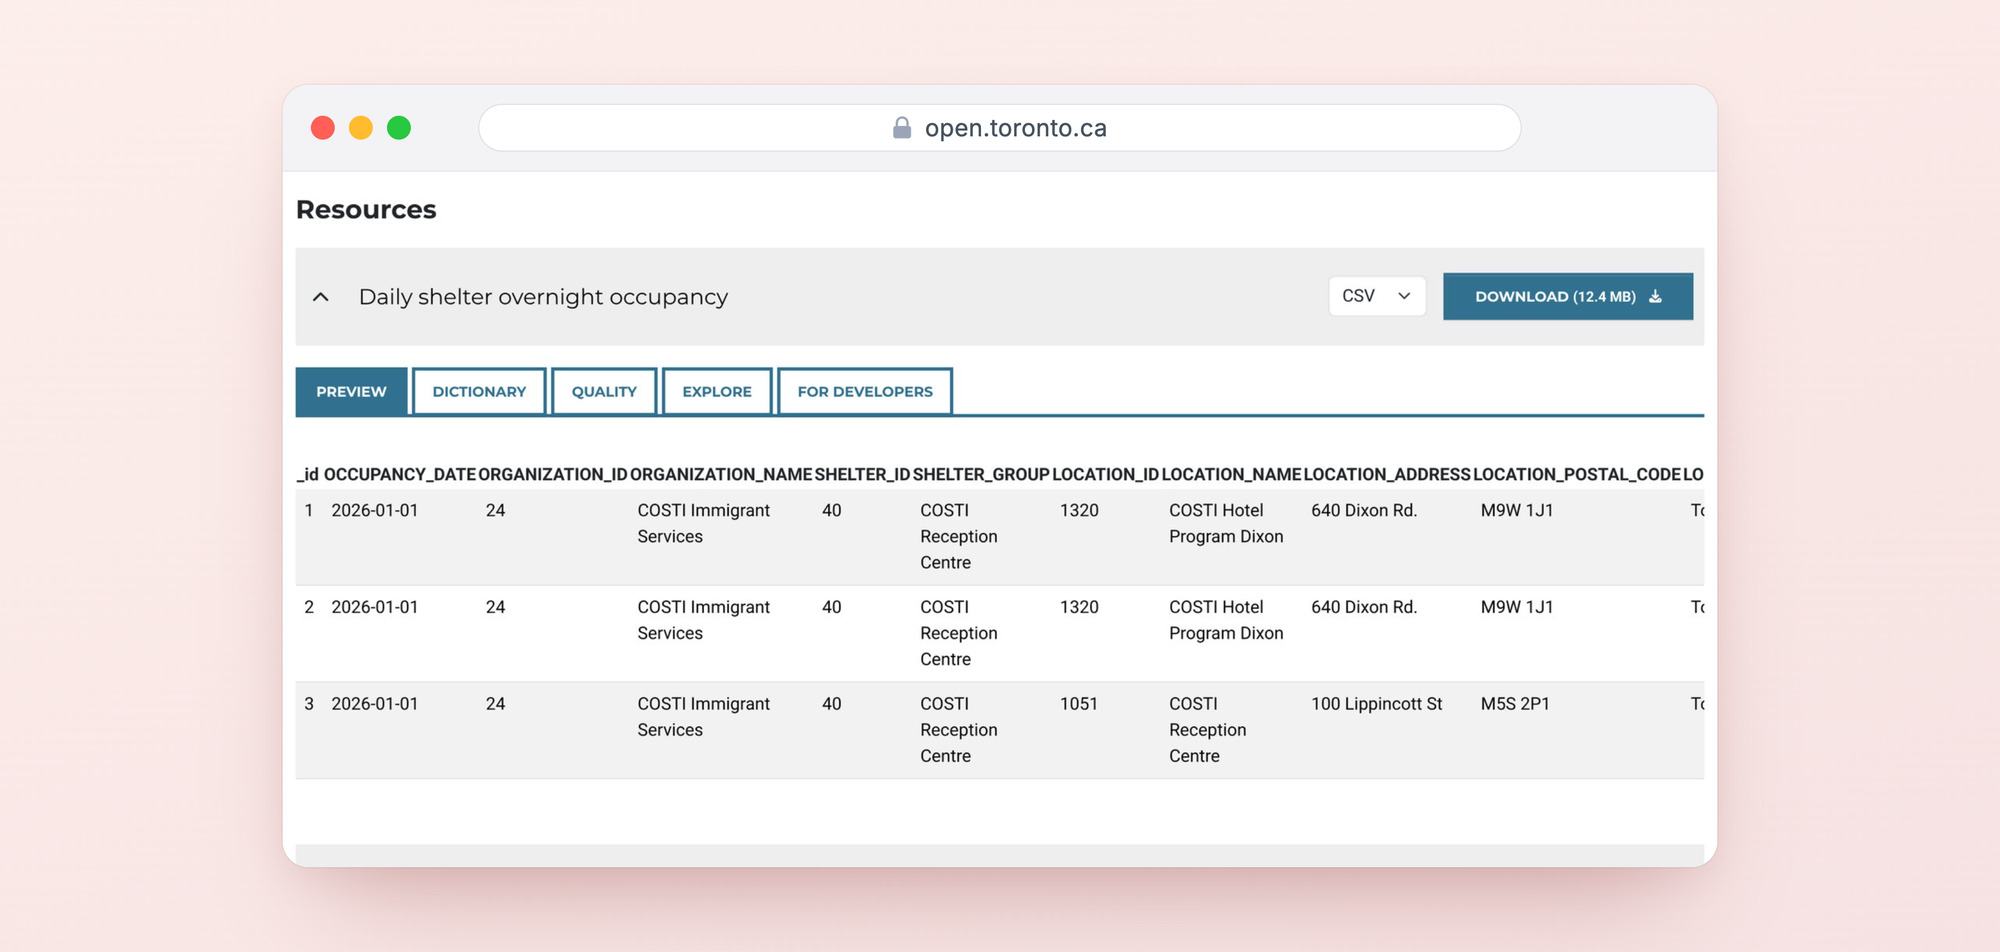
What changed. Before, field definitions, the quality score and the data preview were only available for a dataset’s first resource. The redesigned pages, launched in July 2025, show that information for every resource, with less clutter and less scrolling.

The research behind the 2025 redesign
13
Other data portals reviewed
53
Survey responses
16
Usability interviews
A resource on a Toronto dataset page, expanded to show Preview, Dictionary, Quality, Explore and For Developers tabs
Every resource now has its own Preview, Dictionary, Quality, Explore and For Developers tabs. Screenshot: open.toronto.ca, City of Toronto.
For your portal
Before redesigning your portal, test real user tasks with real users: finding data, understanding its fields, and accessing it.

Research first, then redesign. Users show you what to fix.

03
Build around your needs with open source

Toronto combines WordPress for its public-facing website, data stories and blog with CKAN for data management and APIs. Toronto chose this combination to make it easier to keep developing the portal together with its open data community, and separating the experience people see from the engine that stores and serves the data lets the team shape each one around its needs.

Open by default. Toronto publishes its portal customisations and CKAN extensions on GitHub, so other portal teams can read the code and learn from the implementation. One example is ckanext-iotrans, which converts large datasets into different file formats and map projections, packaged so other organisations using CKAN can reuse it.

How Toronto’s portal is put together
The website people see
WordPress
Pages, data stories and the blog
The public-facing experience
The data engine
CKAN
Data catalogue, storage and APIs
Data publishing and access
For your portal
Document and share your portal customisations, so other teams can learn from them and build on them.

A flexible front end, a solid data engine. Both open source.

04
A good portal needs good publishing processes

In 2023, Toronto moved to centralise open data publishing through its portal. City divisions get guidance on preparing, publishing and maintaining datasets, and by 2024, 43 of the City’s 44 divisions were represented in the catalogue.

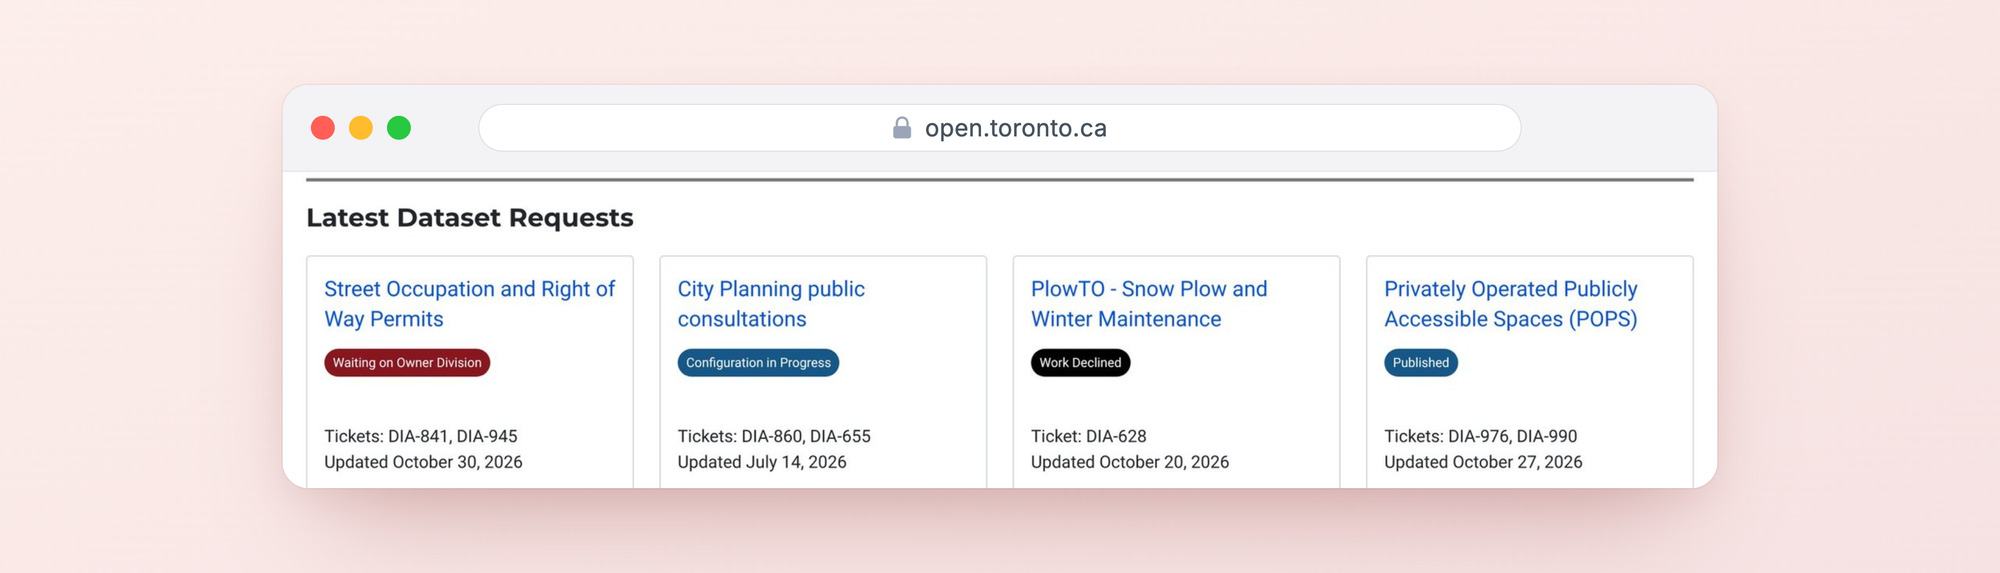
Requests in the open. Anyone can request a dataset and follow requests on the portal’s public request page, including the ones the team can’t take on.

Request statuses anyone can see
Waiting on owner divisionConfiguration in progressPublished
Work declinedEven a “no” is shown in public.
Latest dataset requests on Toronto’s portal, each with its current status
Latest dataset requests on Toronto’s portal. Screenshot: open.toronto.ca, City of Toronto.
For your portal
Define who owns each dataset, how it gets published, and who is responsible for keeping it current.

Software publishes data. Processes keep it useful.

05
Keep the community close, and be honest about the hard parts

Beyond the portal, Toronto runs the Toronto Open Data Awards, hands-on Open Data Jams and demo nights, a gallery of projects built with City data, and data stories on its blog, including community contributions.

Not without challenges. Toronto openly reports its operational challenges, including a growing backlog of dataset requests and technical debt, in its quarterly updates, and even publishes its API usage as open data. The team has also been working on a new Open Data Policy, with clearer roles and responsibilities.

For your portal
Share what your portal team is learning, including what’s not working. Transparency builds trust.
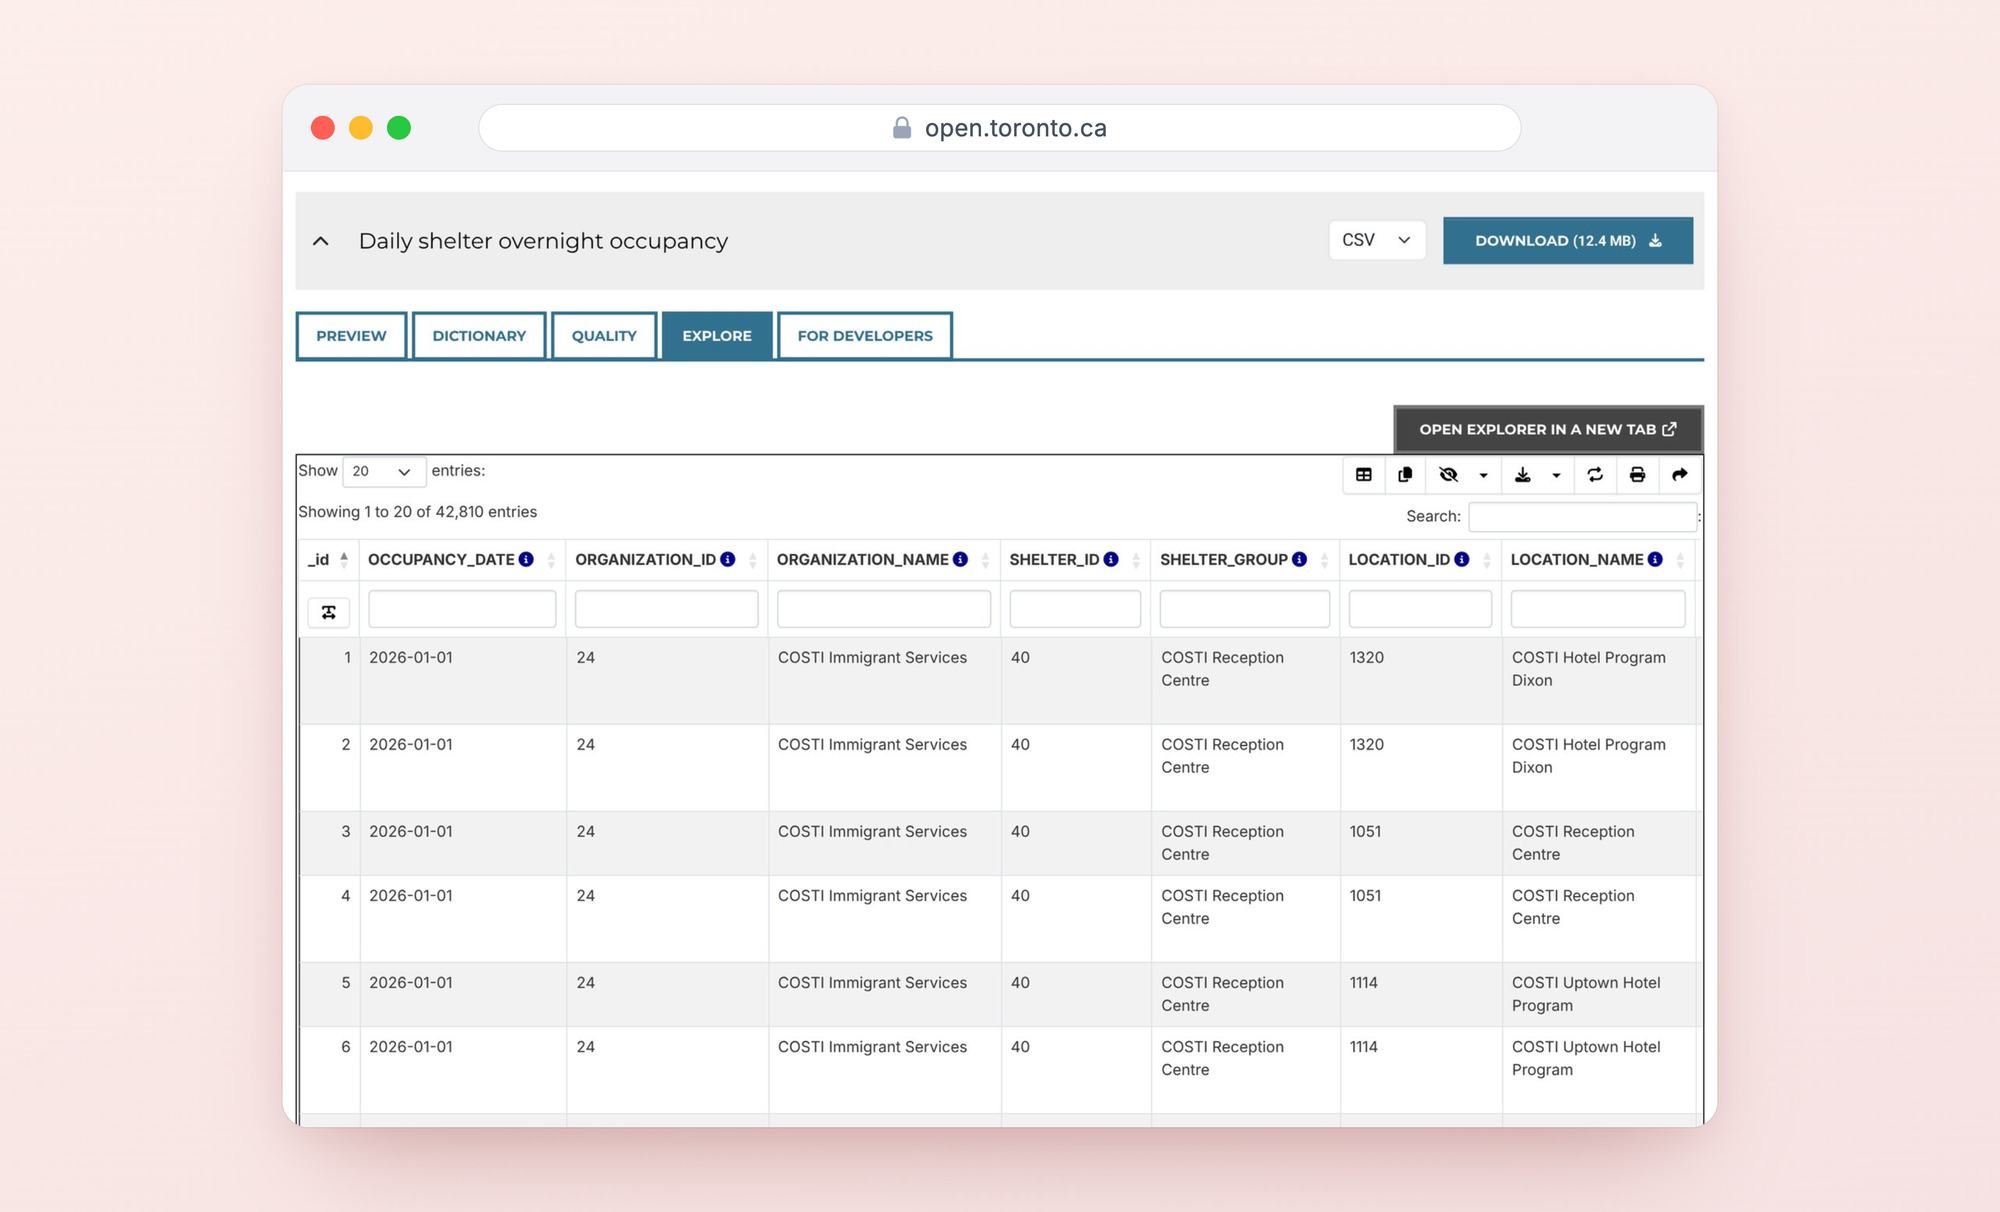
The Explore tab on a Toronto dataset resource: a searchable, filterable table with download options
The Explore tab: search and filter a dataset, then download what you need. Screenshot: open.toronto.ca, City of Toronto.
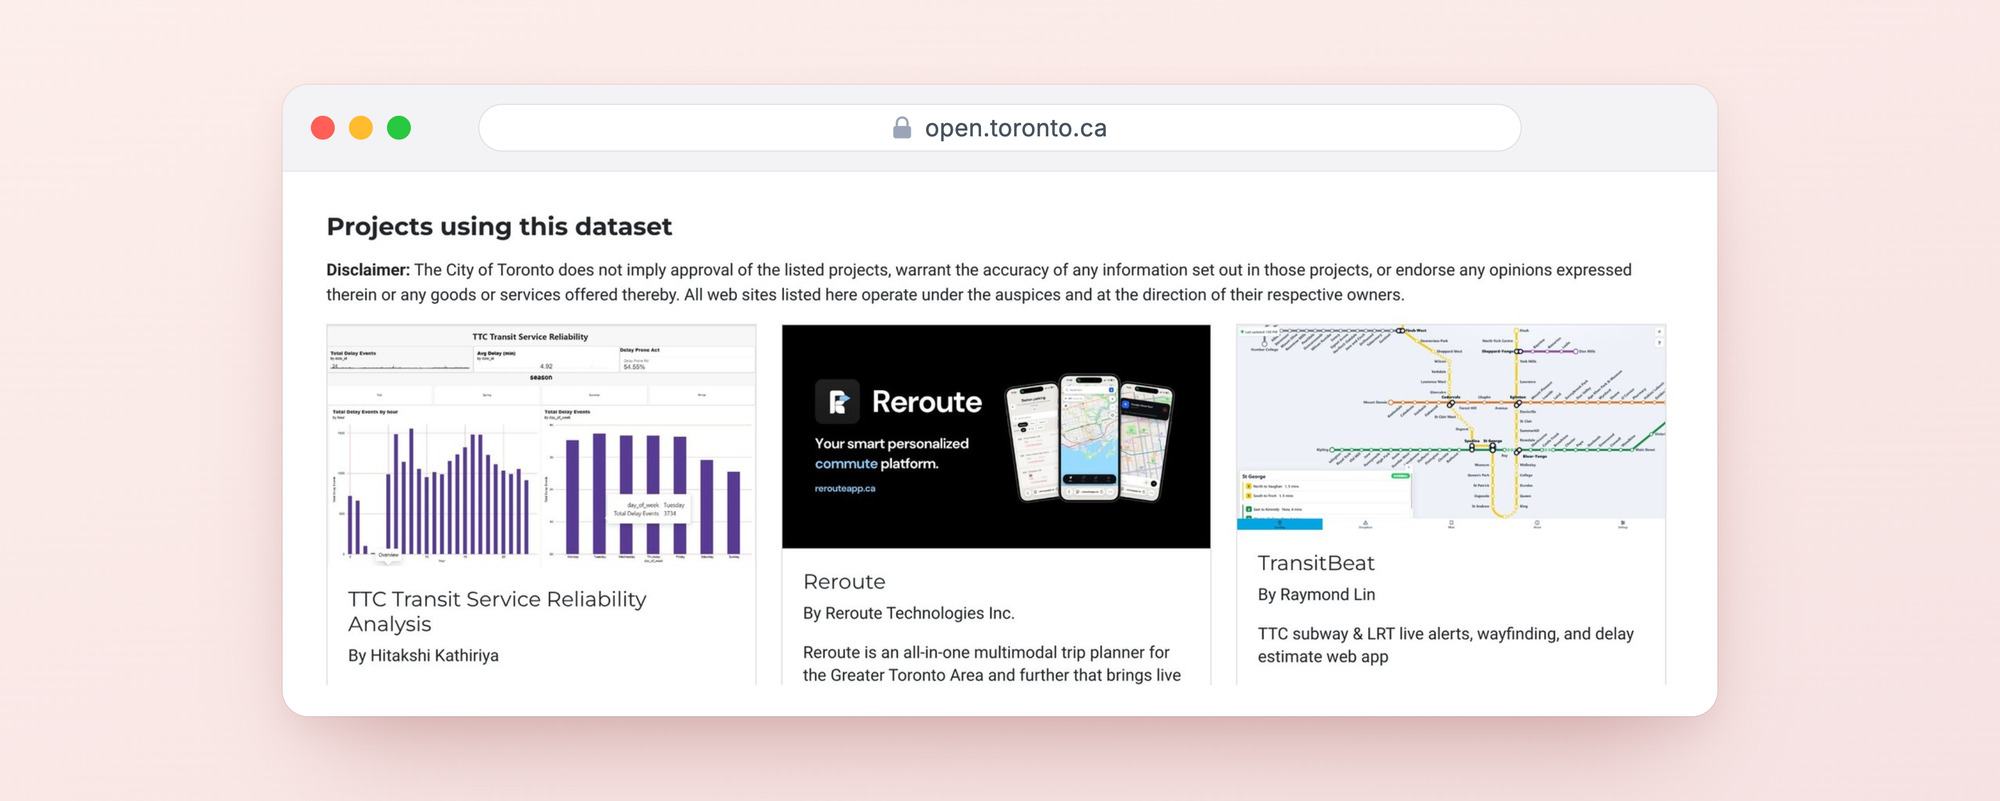
The Projects using this dataset section on Toronto’s TTC Subway Delay Data page
Projects using a dataset, shown on its page: TTC Subway Delay Data. Screenshot: open.toronto.ca, City of Toronto.
Get involved

Know a CKAN portal that deserves the spotlight? Nominate it for Site of the Month. Built something with Toronto’s open data? The Toronto Open Data Awards are open for submissions until 4 December 2026.

Have questions or ideas to share with other portal teams? Join the conversation on Gitter / Matrix or open a discussion on GitHub.


Further reading
Explore Toronto’s Open Data Portal
Led by the City of Toronto Open Data team.
Further reading
Toronto in the CKAN Ecosystem Catalog
See Toronto’s portal alongside other CKAN deployments around the world.